A look at Las Vegas Sands (LVS)
We want to show an example on why the Optimism-Pessimism Index, which is a part of our “Pulse of the Market” charting software, is so important in calculating an accurate reading on volume. Getting an end of day value on volume from most charting software, might not tell the whole story. But here at Wyckoff SMI, looking at the intra-day waves and breaking down the volume as such, gives you a much more accurate reading of the days volume and what occurred during the days trading. Thus an accurate view of supply and demand to help with the taking of positions using the Wyckoff Method.
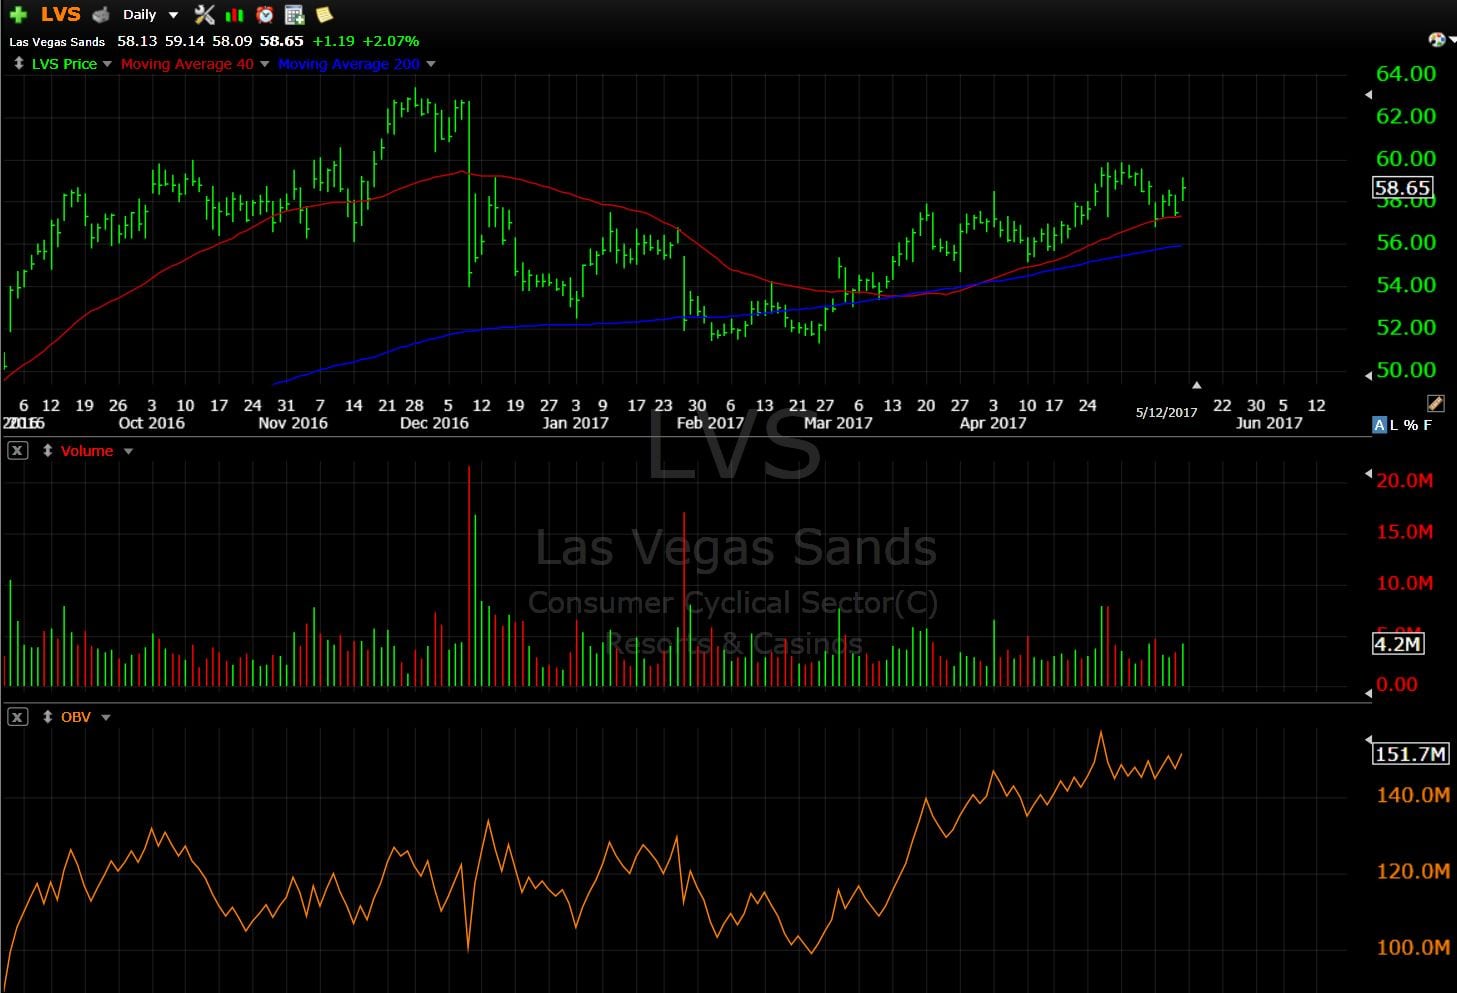
The following is a daily chart of LVS from May 12th. You can see the last day posted shows the stock up $1.19 on volume of 4.19 million shares. The volume is a green bar since the stock closed plus for the day. The orange line at the bottom of the chart is the “On Balance Volume” which was an indicator the late great Joe Granville made famous. It is plus showing the days volume recorded as all up volume as well.
The green and orange volume figures are what we take issue with… It does not give a true indication of the days action.
The following intra-day chart from our software, shows that the days volume was actually minus for the day. Everything to the right of the blue vertical line is the days action from May 12th we are scrutinizing. You can see the O-P at the bottom opened slightly higher, on the stock opening sharply higher, then the O-P spent the rest of the day in a steep downtrend that was at its worse level at the close. But the stock spent the day going sideways after the sharp plus opening, and still managed to close $1.19 higher for the day.
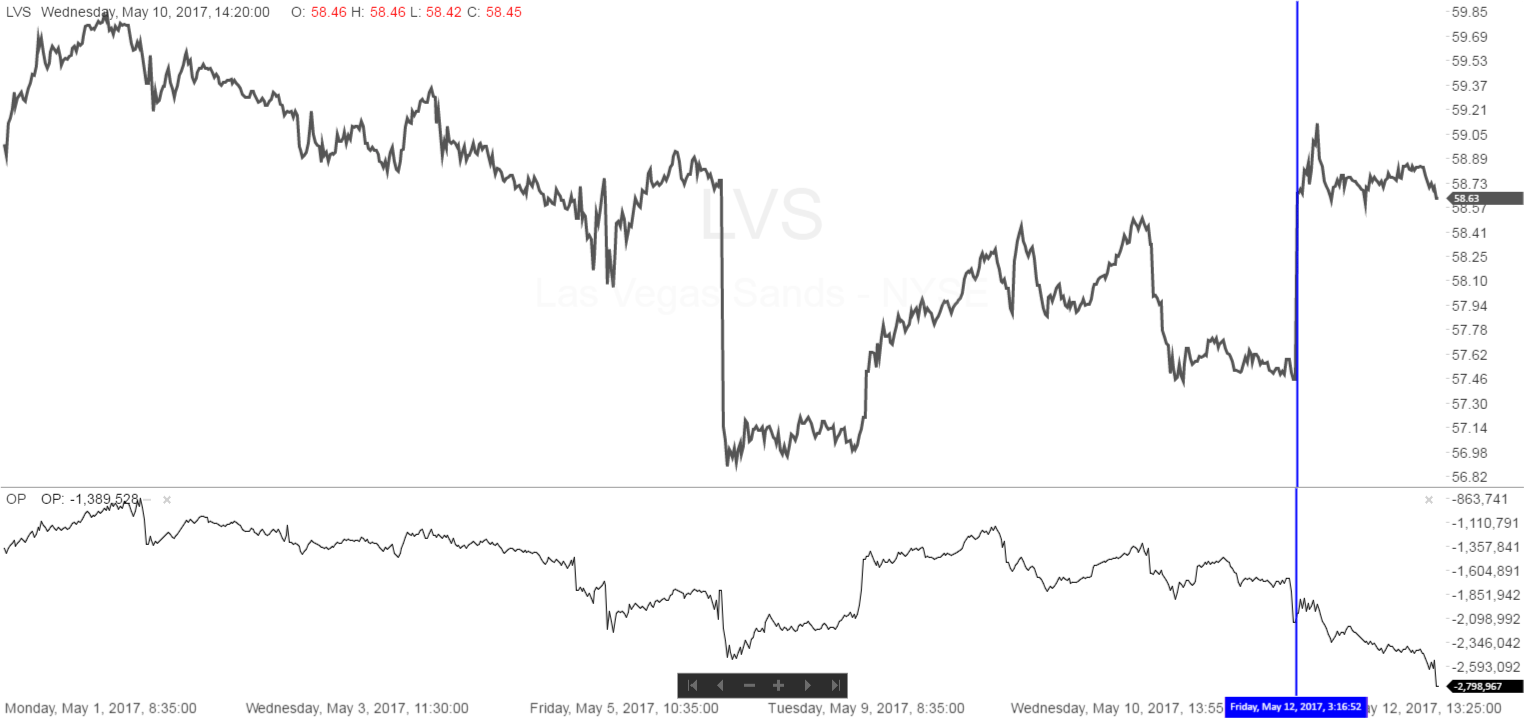
This would make one surmise that the Composite Operator was willing to buy all stock being offered on the down ticks. Supporting the stock expecting higher prices in the near future. Very bullish action…
Wyckoffian’s say they are following Wyckoff methods, but one must be calculating the intra-day waves to be following in Richard D. Wyckoff’s footsteps.
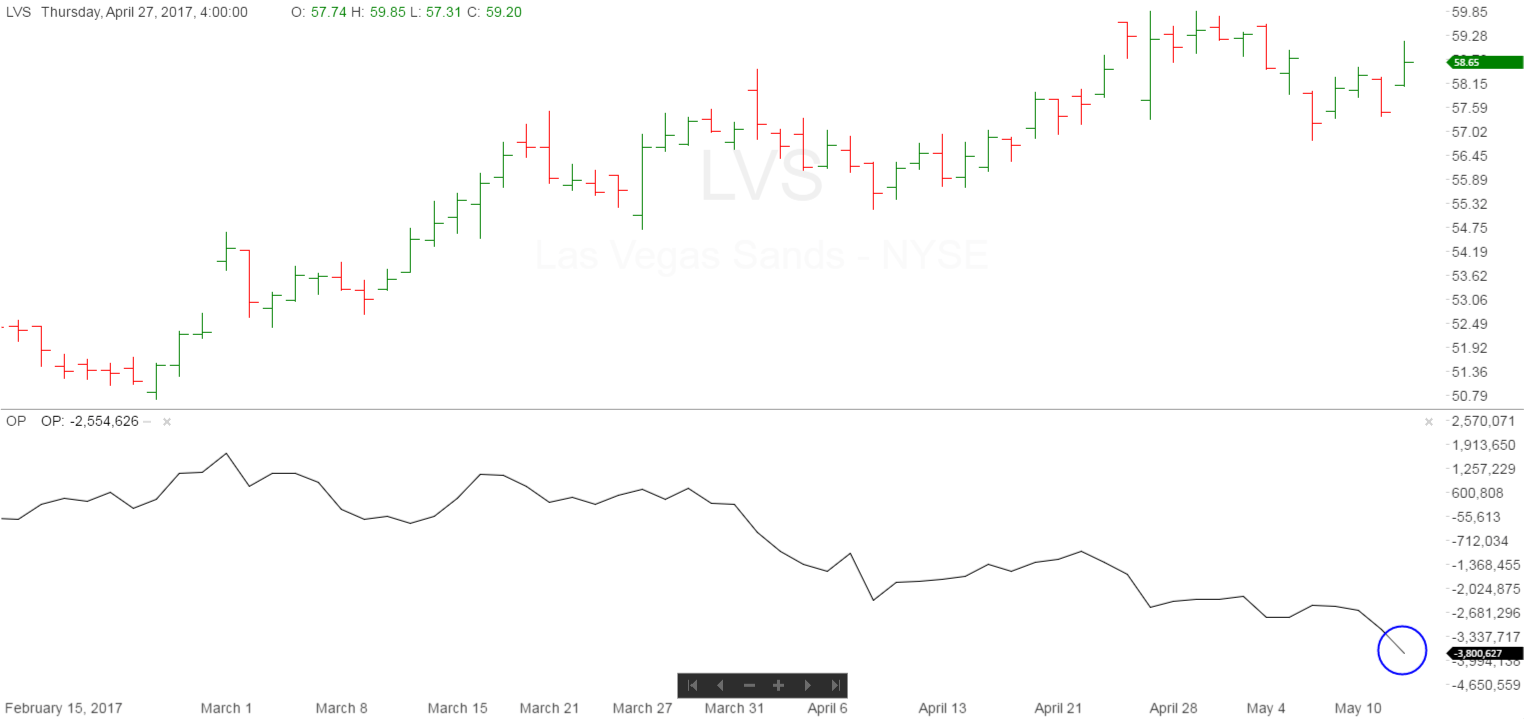
The following chart shows LVS over a 3 month period. The stock has been trending higher, and the O-P has been in a continued downtrend. The blue circle shows the new low being made on the O-P during the day being discussed above. But this chart shows that Las Vegas Sands is having continued selling volume coming into the stock, but the stock is actually trending slightly higher. Someone is supporting the stock….
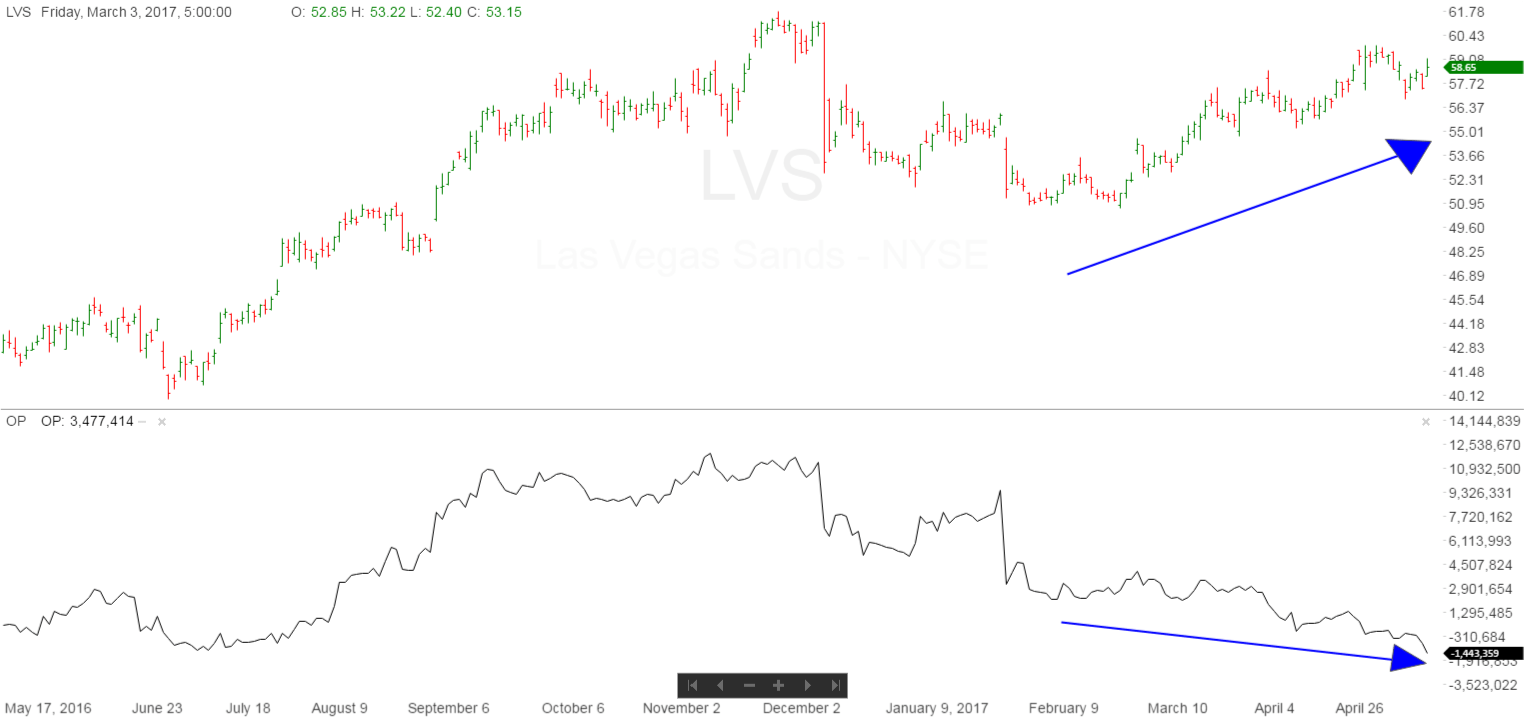
The following is the same chart over a 12 month period. Showing the same action as described above… Selling pressure but the Composite Operator supporting the stock and taking it all in.
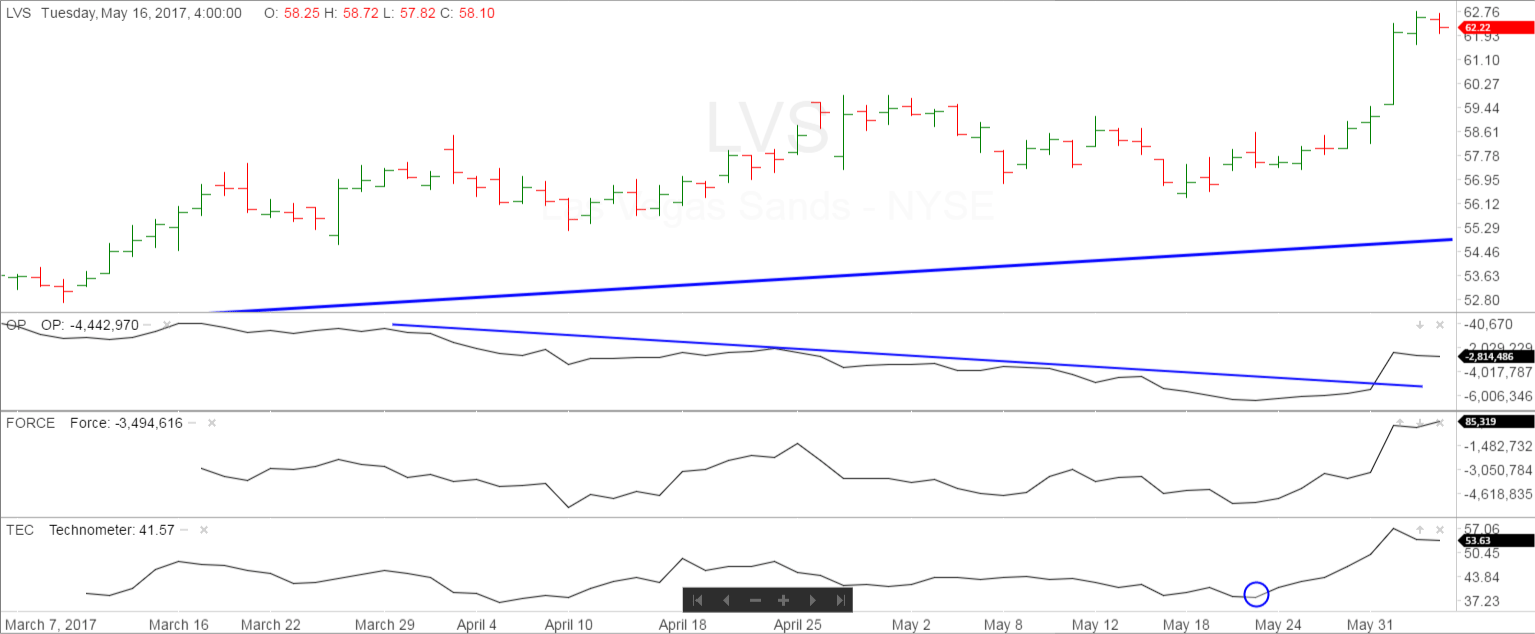
We now want to update Las Vegas Sands chart to today… You can see that the OP in the middle of the chart continued to make new lows until May 23rd. This is when the Technometer finally registered a sub 38 reading which shown an “oversold condition”. This is shown by the blue circle at the bottom.
Then the OP began to show positive action, broke its downtrend line, and the price of Las Vegas Sands responded with a nice run to the upside. This type of action would have been what Mr. Wyckoff said was “On The Springboard”.
You can see from the Point/Figure chart the stock has much higher objectives, and another $10+ before reaching its overbought line of the uptrend.

Good Trading,
Todd Butterfield
Responses