A look at the Van Eck Vectors Gold Miners ETF (GDX) we bought for our ProTraders ETF Model Portfolio
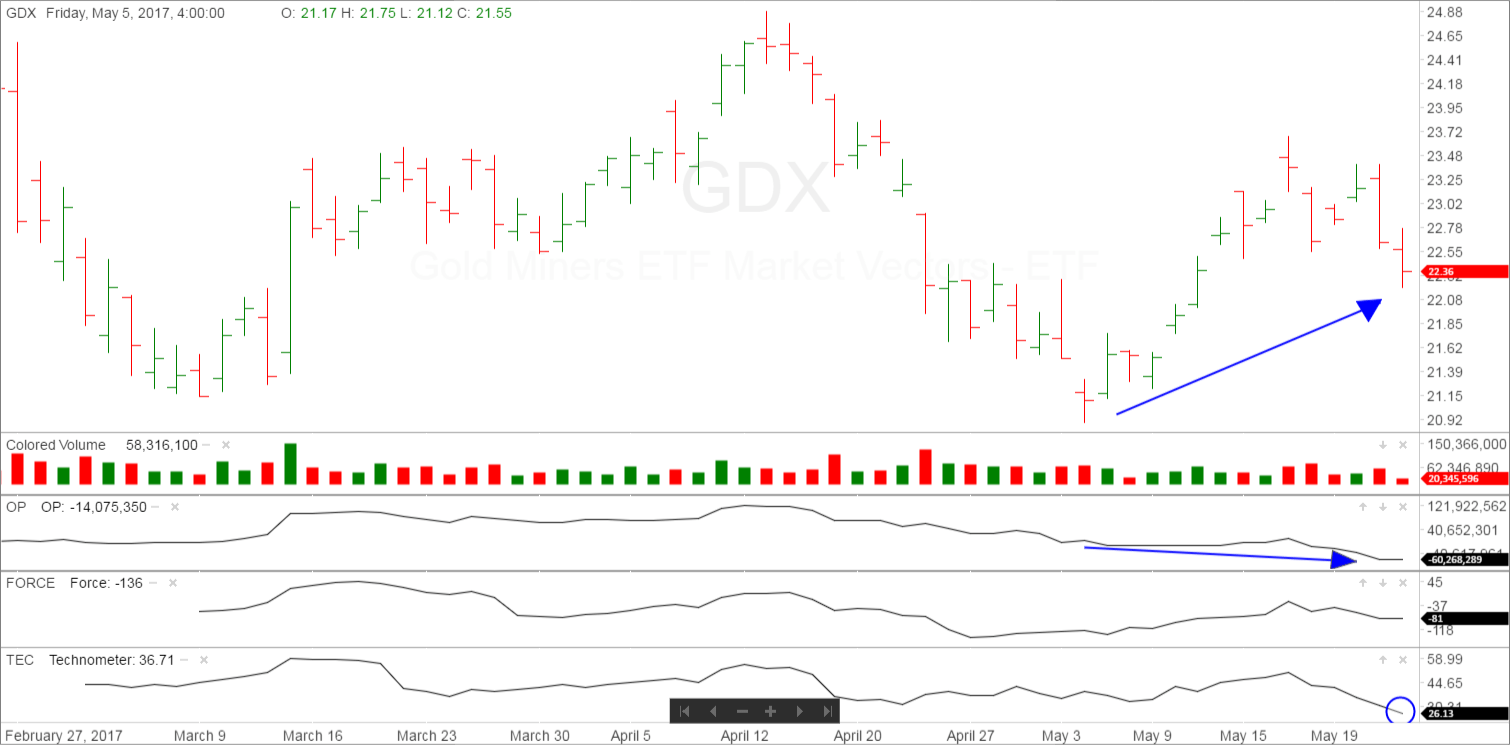
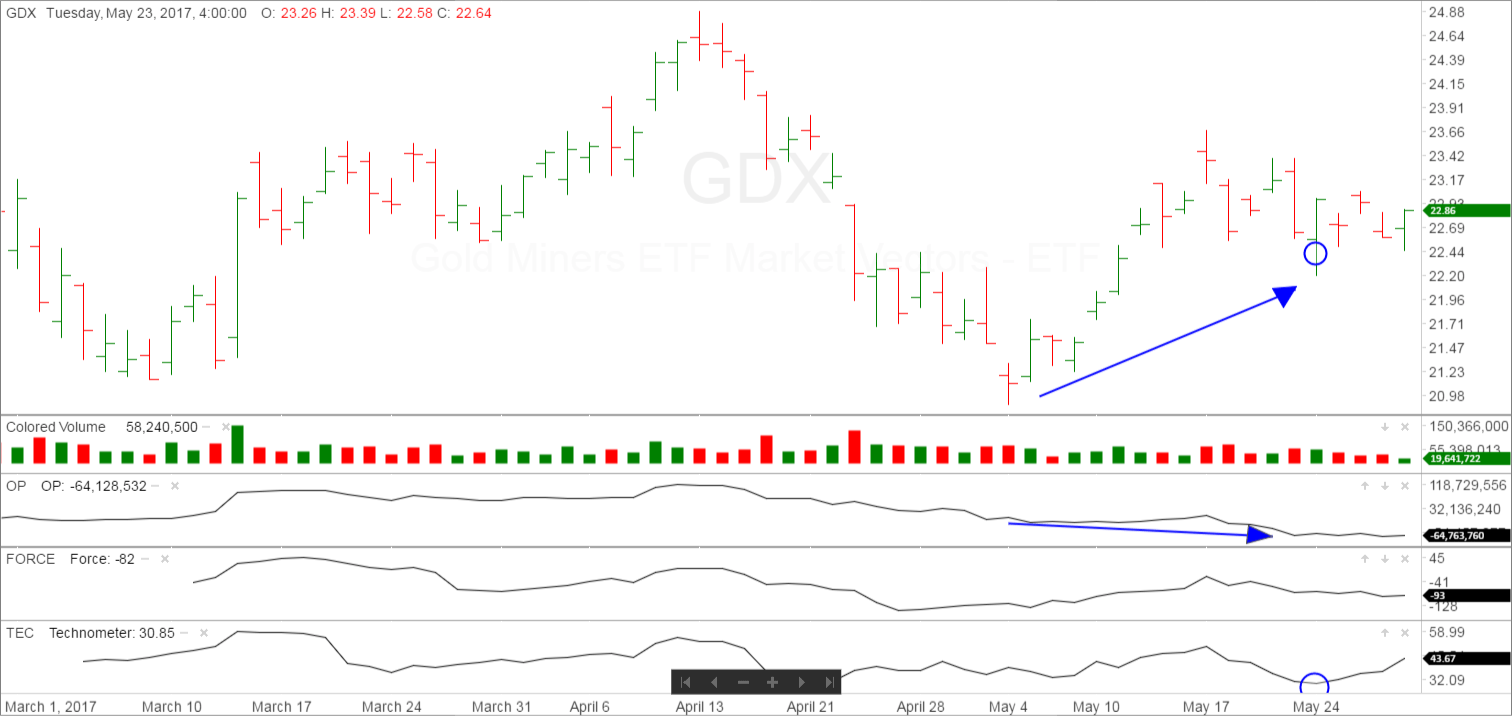
We wanted to go through one of our trades that we just recently did with the use of the Wyckoff Tools. On May 24th, we had GDX in a short term correction of six days. As this correction of a previous advance was in progress, you can see the Optimism-Pessimism Index was touching new lows while the price of GDX was holding on to its previous rally gains. This is depicted with the blue arrows.
As the Optimism-Pessimism Index was touching new lows, our Technometer registered an oversold reading, which told us the conditions were right for some type of rally.
We purchased this ETF at the market and was filled at $22.45. We placed a stop on purchase at $20.89 which was the previous low.
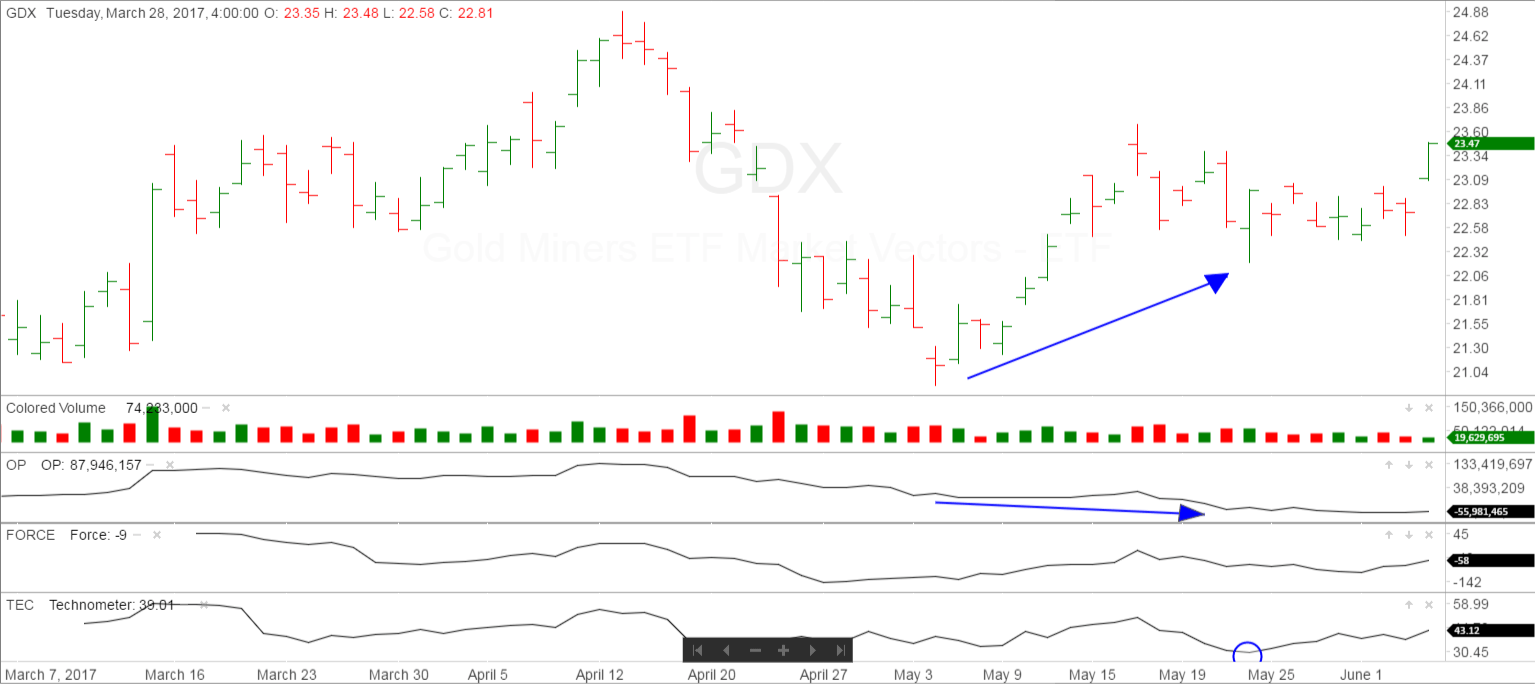
The stock worked sideways for four days with no real gains. Once we saw the trading of May 31st where we tested the lows and was rallying off of them, we raised our stop to $22.20 which was the low of May 24th. Gold/silver had begun to rally the last few days but the GDX appeared to be slow to rally. We wanted to keep risk to a minimum in case we were wrong in our prognosis.
As you can see, GDX spent another 3 days trading lethargic, before today’s strong advance. With this strength we now want to raise our sell stop to breakeven and lets see if this stock can continue its rally from here. The Technometer is trading near neutral and we should be able to see further gains before we have to take anymore action.
These are the type of trades we look for where we can keep risk to a minimum, and try to work into some good positions.
Good Trading,
Todd Butterfield

Responses