The Wyckoff Wave Hugging Support at 51,000
This past week the Wyckoff Wave traded slightly minus after being down sharply for the week early Thursday. It then staged a quick rally to end the week modestly lower. Volume was slightly lower for the week.
The Technometer began the week at near overbought levels, and finished nearing oversold levels.
For the week the S&P was down a very small .33%, and the Nasdaq up 1.3%.
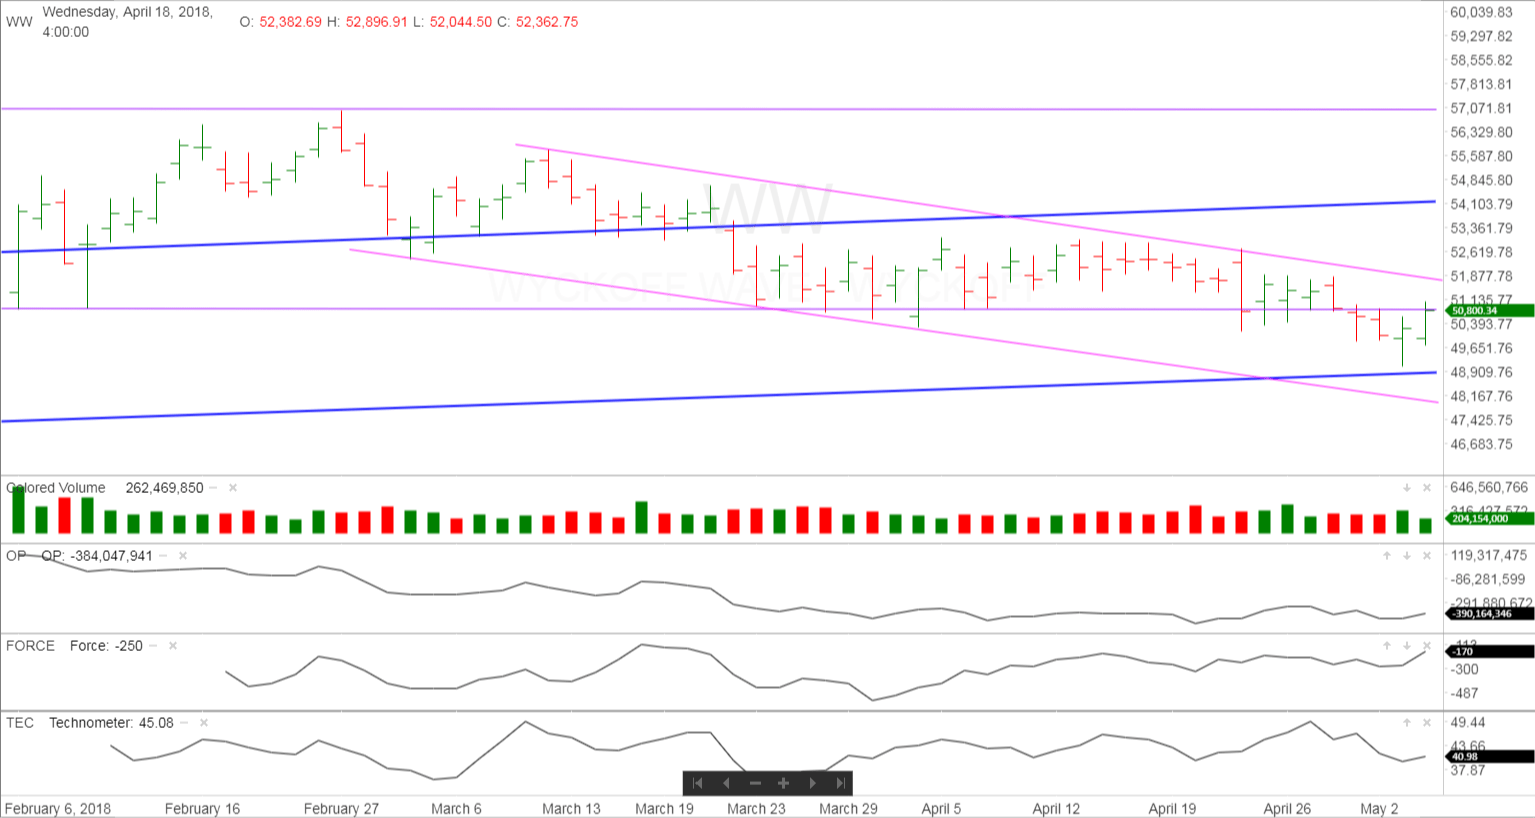
Thus far the Wyckoff Wave is still hovering at the support of 51,000 we have been at for weeks. Last weeks overbought Technometer gave us a chance to decisively break the support at 51,000. As it did this, the Technometer quickly returned to Oversold and we bounced nicely back to the all important 51,000 level.
The O-P did not break to new lows last week and helped us rally into Friday.
The Force Index was also up for the week and at the highest levels in 7 weeks.
The Technometer finished the week nearing oversold levels.

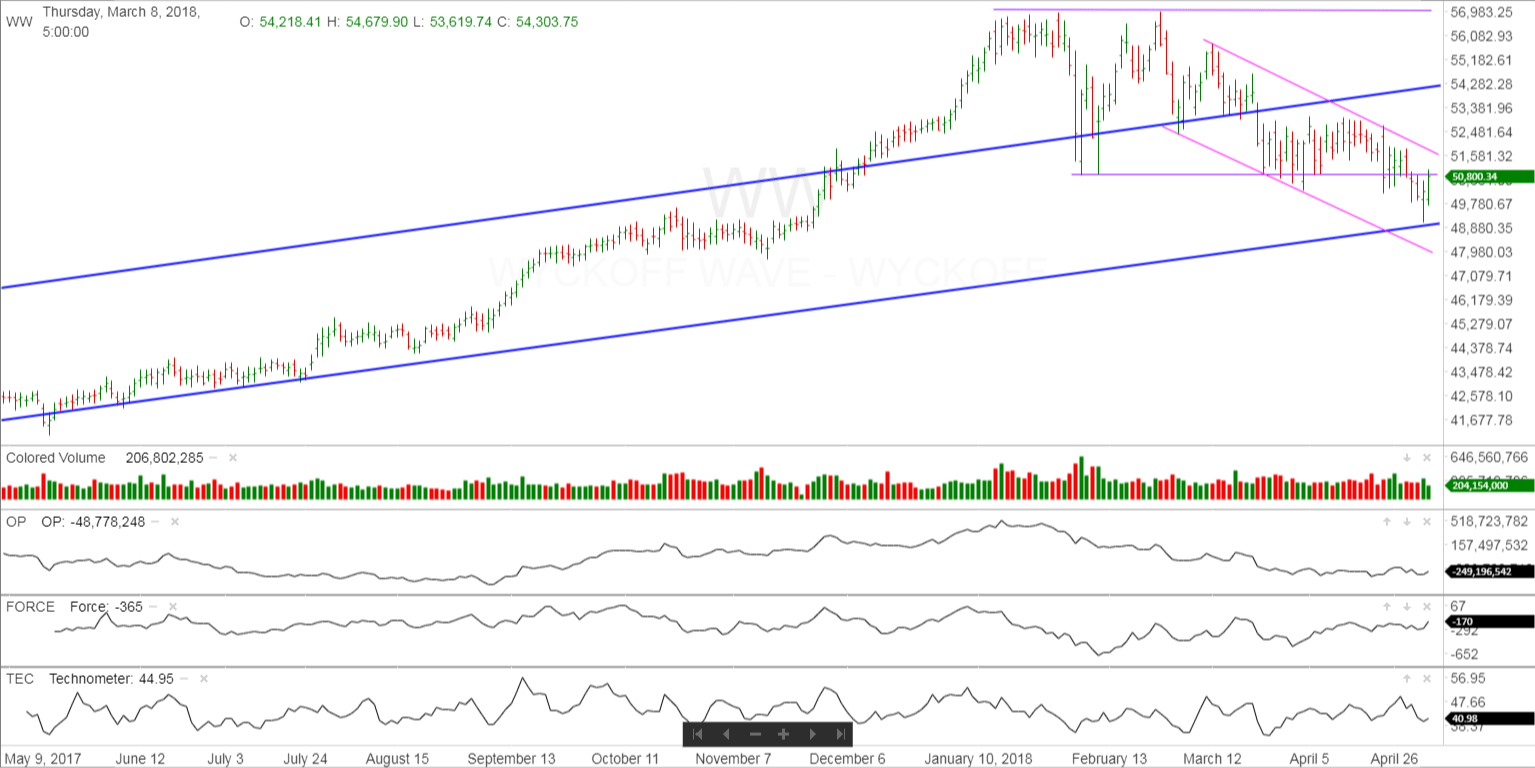
The one year daily chart shows the Wyckoff Wave trading in an uptrend on an intermediate term basis, but in a downtrend on a short term basis. We felt last weeks decline could take us down to the longer term support line of the uptrend in dark blue. It did exactly that and met good support. The Technometer is still oversold so it appears we can continue the rally of last week at least for the early part of the week. We will want to watch the early action to get a better feel for the immediate future.
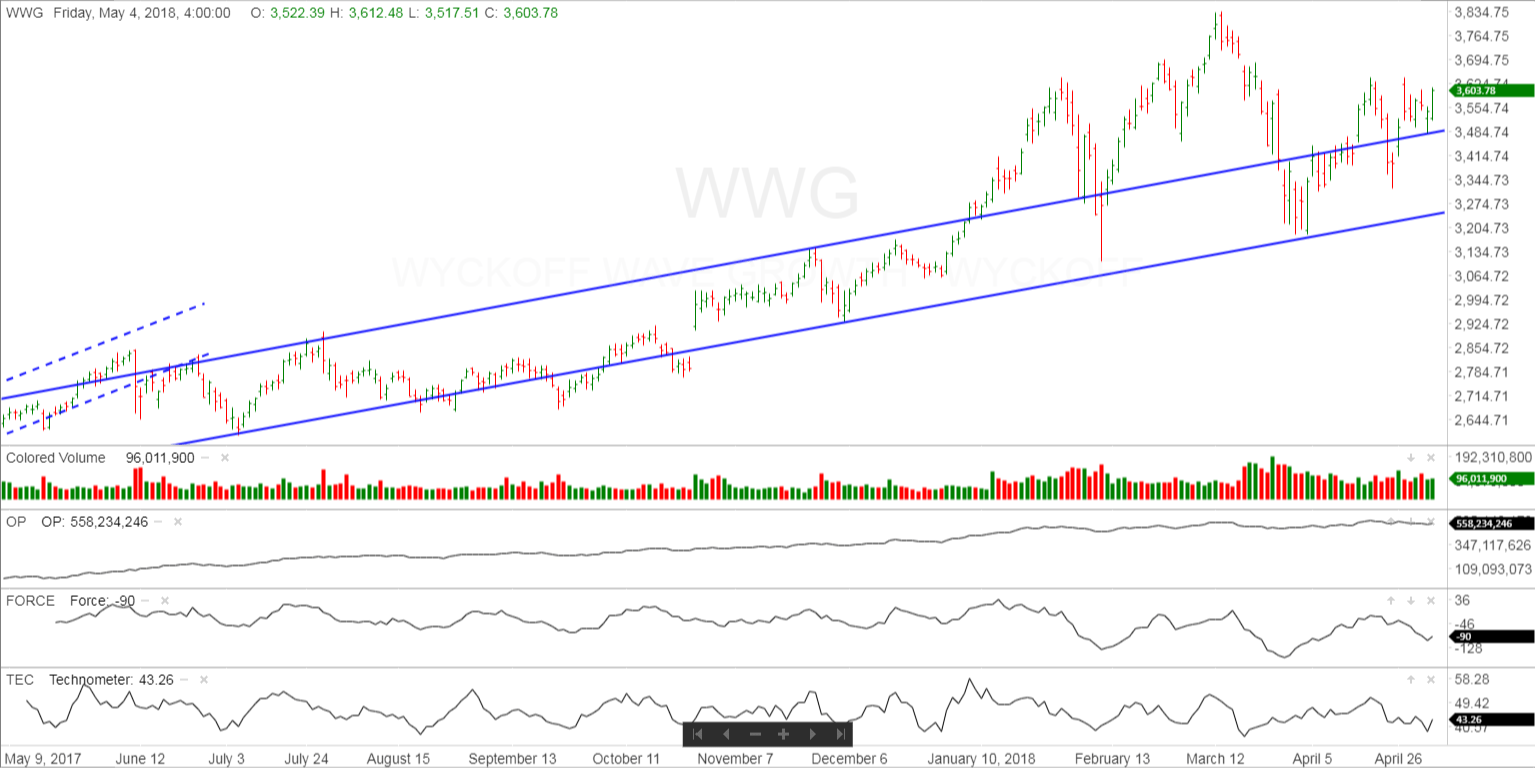
The Wyckoff Wave Growth Index (WWG) held to only minor losses early in the week, then rallied nicely on Friday. It also has an oversold Technometer and met support at its overbought trendline of its longer term uptrend. Very bullish action for the week. It would appear that it can make a run at its recent highs.
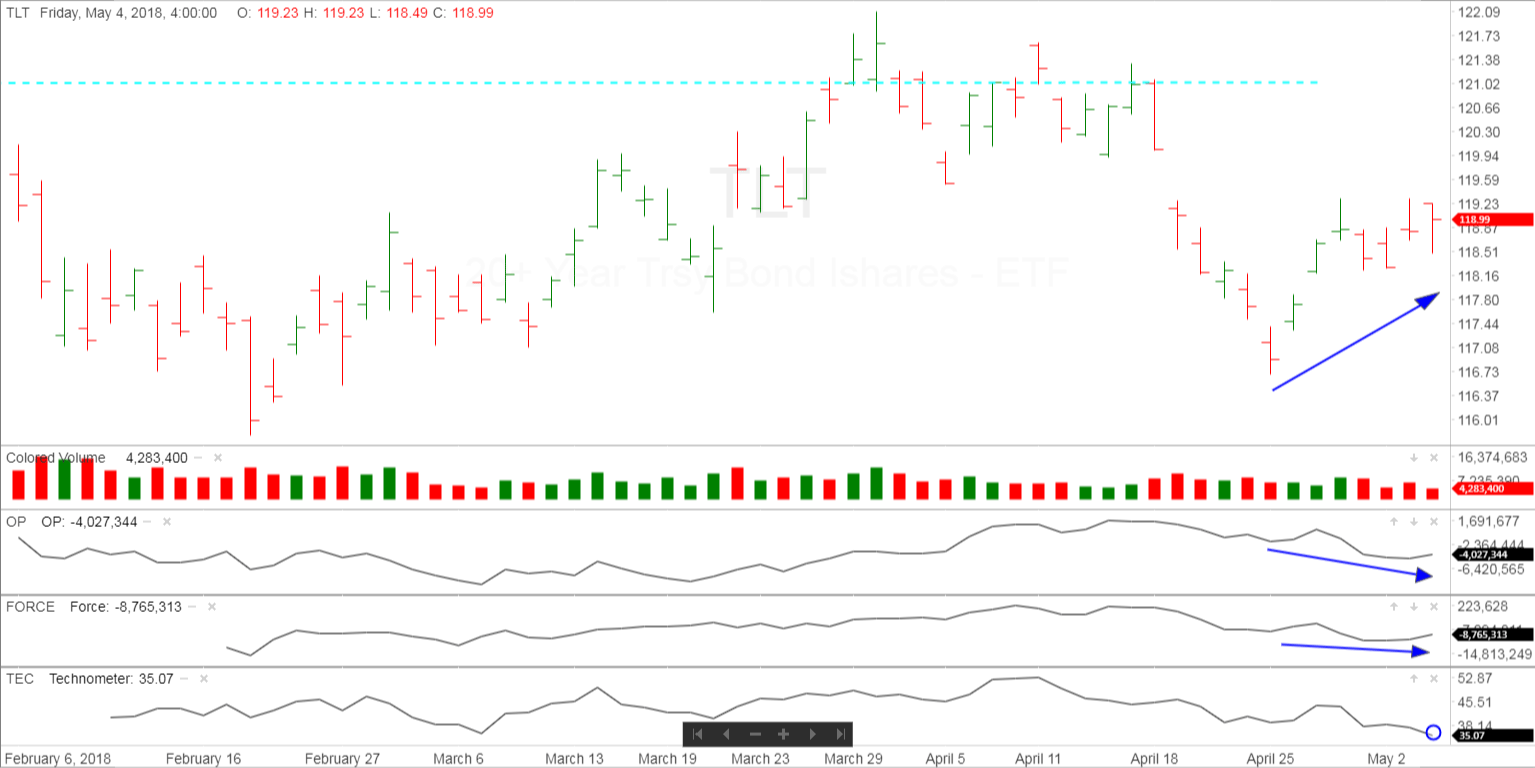
The bond market spent the week trading sideways and closing slightly higher. You can see the OP and Force went to new lows for the recent selloff marked with the blue arrows. The price has held nicely at higher support. We also have the Technometer at oversold levels as marked by the blue circle. These conditions should let prices move higher from these levels. We are covering our shorts from $125.08 and going long at Monday’s opening.
IMPORTANT ANNOUNCEMENT: We will soon be launching our “Pulse of The Market” for Cryptocurrrencies. This software will have consolidated volume for the Crypto’s which will be most important when applying Technical Analysis. We have had delays in the launch as getting correct volume data from 39 exchanges has been a monumental task for our software.
Due to the demand for Bitcoin/Cryptocurrency information and trading knowledge, we released a Cryptocurrency and Wyckoff Trading Course at our site, LearnCrypto.io This course is being offered at an affordable $299.99. We have had 920 students enroll in the last 43 weeks.
If you are interested in Cryptocurrency news and Wyckoff chart analysis, search “Learn Crypto / Wyckoff SMI” or click this link https://www.youtube.com/channel/UCDxK2PwEDvoaHZgjPV_WgcA
Please subscribe and click the bell to be notified of our upcoming broadcasts.
Our current schedule is Monday-Thursday approximately 6:30 p.m. CST, and they usually last approximately one hour. We will also broadcast at additional random times since we want to satisfy our international subscribers as well.
If you would also like to follow us on twitter for news and trade ideas, follow “LearnCryptoShow”, or “WyckoffonCrypto”. We have given numerous profitable trades to our subscribers on the Youtube channel, as well as Twitter.
Good Trading,
Todd Butterfield

Responses