The Wyckoff Wave Still at Bottom Of Recent Range
This past week the Wyckoff Wave traded mostly sideways with the exception of Tuesdays wide spread up and down. We ended the weak slightly lower after all the trading had ended. On Tuesday we once again experienced what could be a possible spring, but the action since then has been repeated a few times in the last few weeks. After the spring, we get no strong follow through, and volume does not support the positive action either. So this still leaves us vulnerable to a breakout to the downside. Volume was average for the week.
The Technometer began the week at slightly oversold levels, and finished nearing overbought levels.
For the week the S&P was basically flat, and the Nasdaq down a slight .36%.
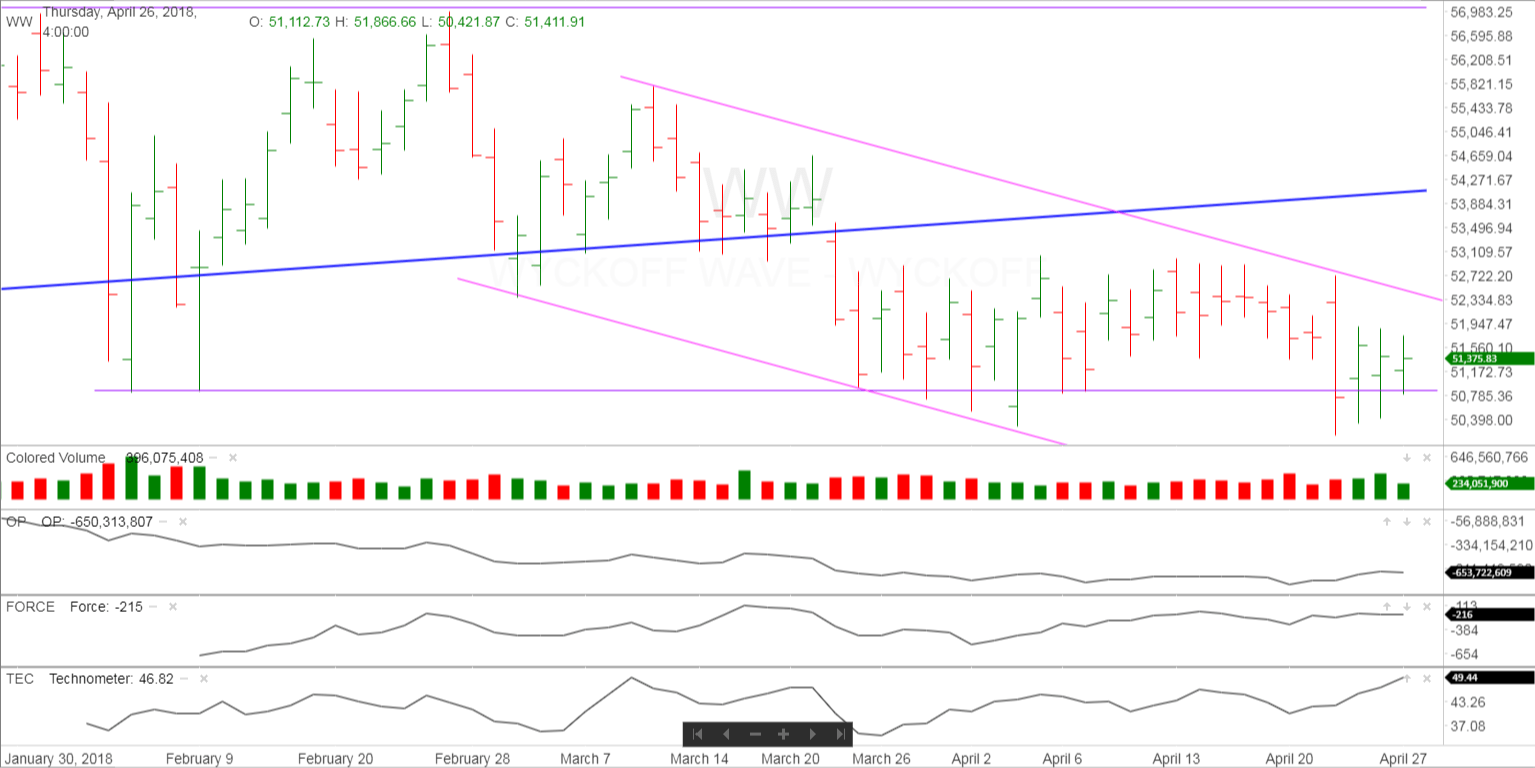
Thus far the Wyckoff Wave is still hovering at the support of 51,000 we have been at for weeks. Last weeks oversold Technometer told us to not be on the look at to a hard break to the downside, but for support to probably be found. But now we are nearing overbought levels, and we are still trading very close to the danger zone. It will not take much selling now to drive us below the support at 51,000. It appears this week we will have to contend with that possibility.
The O-P had not rallied at all since the short term lows of Feb 5th. It continues to trade near the lows.
The Force Index was up slightly for the week.
The Technometer finished the week nearing overbought levels.
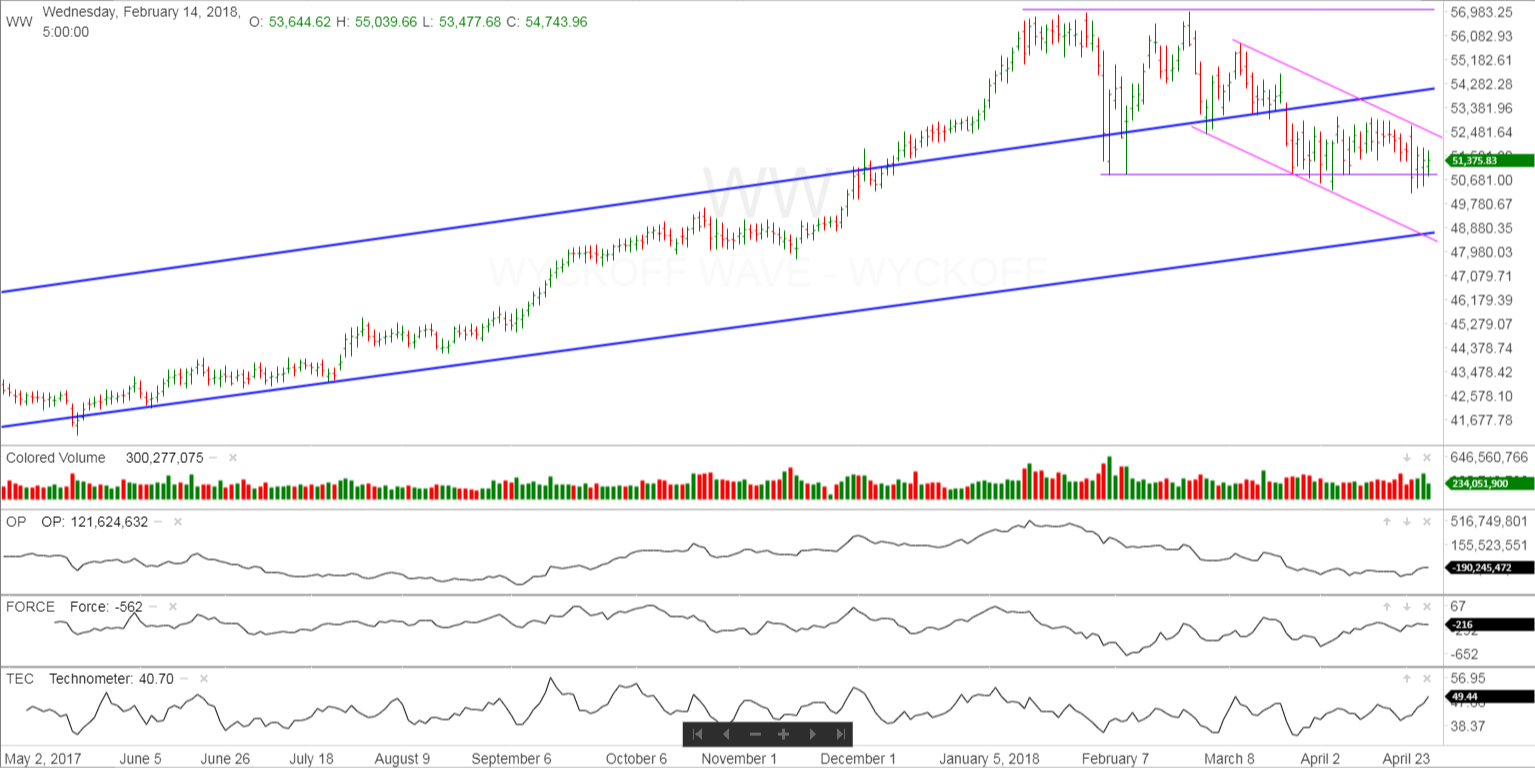
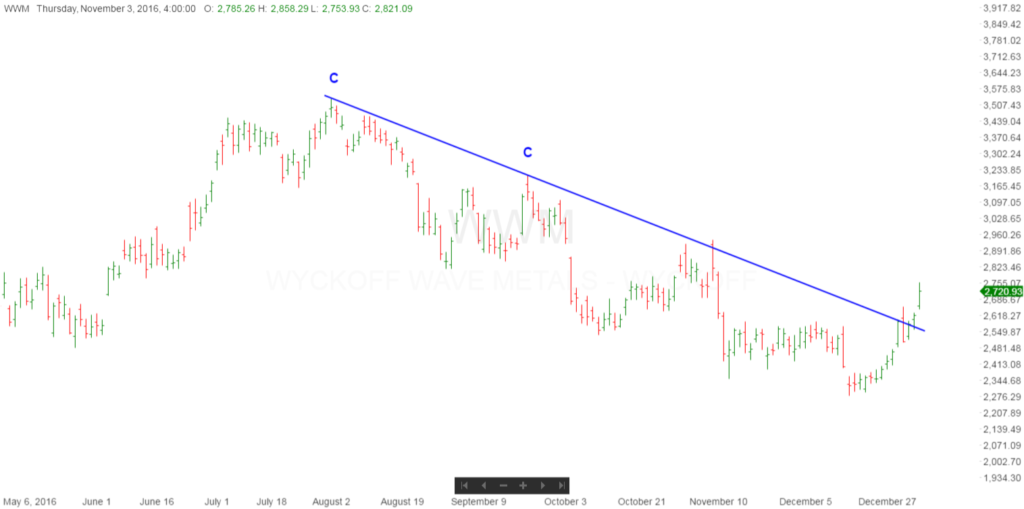
The one year daily chart shows the Wyckoff Wave trading in an uptrend on an intermediate term basis, but in a downtrend on a short term basis. The recent support appears to be weakening, and we could see a move to the support line of the dark blue uptrend.
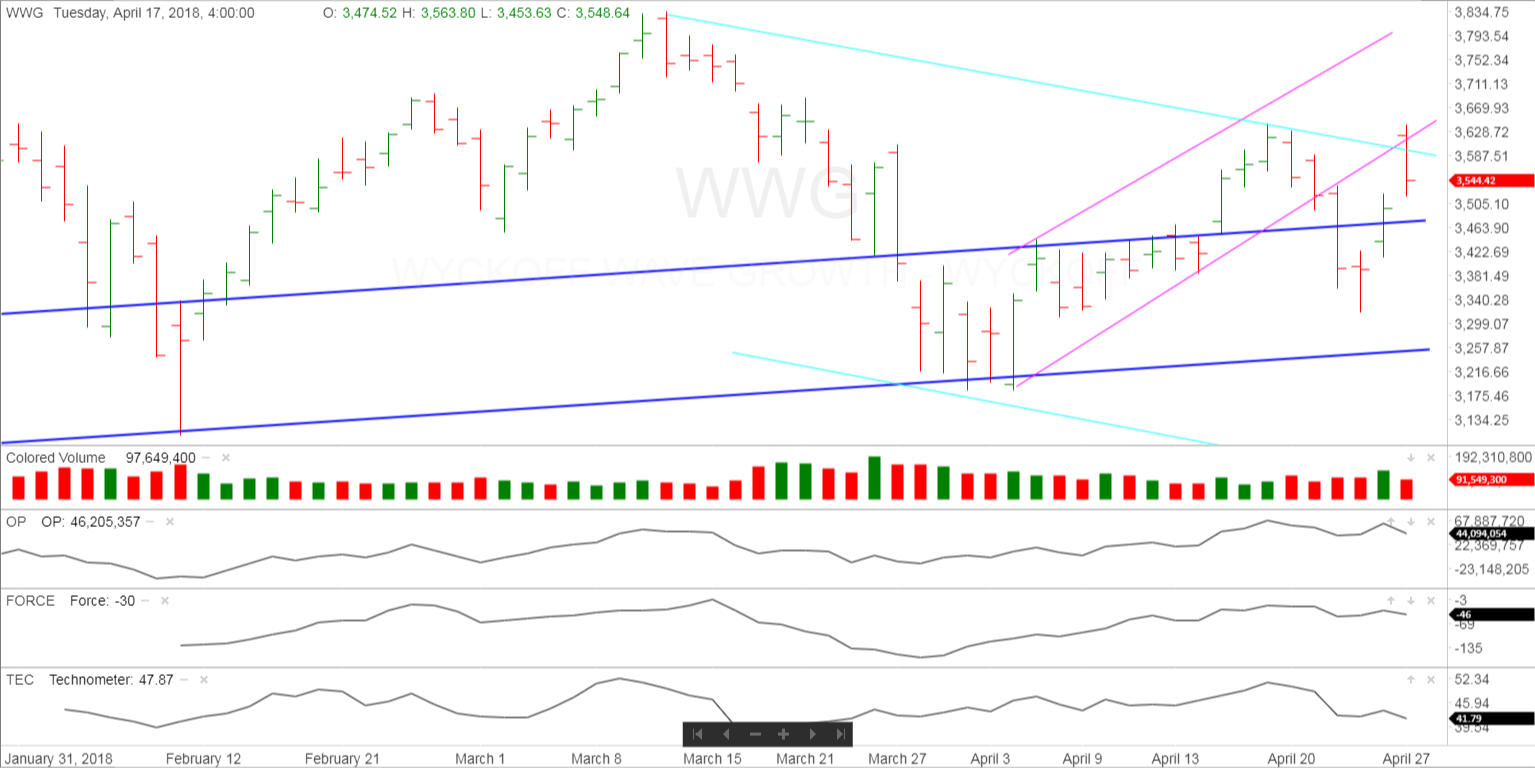
The Wyckoff Wave Growth Index (WWG) began the week trading sharply lower, then on Wednesday turned sharply higher for the rest of the week. The Technometer reached overbought levels the previous week, and on Friday we had what appears to be a successful test of the previous week’s highs as well as the supply of the recent light blue downtrend. We would expect this market to work lower to the support line of its recent dark blue uptrend as well.
The bond market began the week working lower, and then rallied back late in the week to finish basically unchanged for the week. We are holding shorts from $125.08 and looking for new lows.

IMPORTANT ANNOUNCEMENT: We will soon be launching our “Pulse of The Market” for Cryptocurrrencies. This software will have consolidated volume for the Crypto’s which will be most important when applying Technical Analysis. We have had delays in the launch as getting correct volume data from 39 exchanges has been a monumental task for our software.
Due to the demand for Bitcoin/Cryptocurrency information and trading knowledge, we released a Cryptocurrency and Wyckoff Trading Course at our site, LearnCrypto.io This course is being offered at an affordable $299.99. We have had 918 students enroll in the last 41 weeks.
If you are interested in Cryptocurrency news and Wyckoff chart analysis, search “Learn Crypto / Wyckoff SMI” or click this link https://www.youtube.com/channel/UCDxK2PwEDvoaHZgjPV_WgcA
Please subscribe and click the bell to be notified of our upcoming broadcasts.
Our current schedule is Monday-Thursday approximately 6:30 p.m. CST, and they usually last approximately one hour. We will also broadcast at additional random times since we want to satisfy our international subscribers as well.
If you would also like to follow us on twitter for news and trade ideas, follow “LearnCryptoShow”, or “WyckoffonCrypto”. We have given numerous profitable trades to our subscribers on the Youtube channel, as well as Twitter.
Good Trading,
Todd Butterfield

Responses